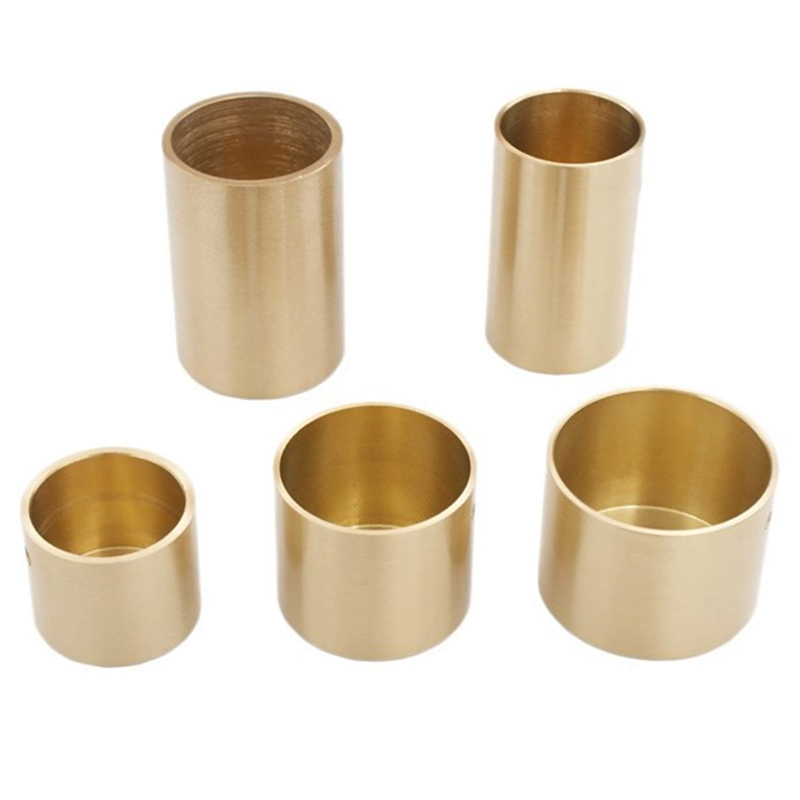
導入 アルミニウムブロンズチューブは、優れた熱伝導率、腐食抵抗、耐久性により、産業熱交換器アプリケーションでますます重要になっています。このガイドでは、熱伝達効率と運用パフォーマンスを最大化するための最適化戦略を調査します。
材料の特性と選択 熱交換器チューブ用の標準的なアルミニウムブロンズグレード 学年 構成 熱伝導率(W/m・K) キーアプリケーション C61300 Cu-Al-Ni-Fe 45-52 化学処理 C61400 cu-al-ni-fen 42-48 海洋熱交換器 C63000 Cu-Al-Fe-Ni 38-45 高圧システム C63200 cu-al-fa-six-si 40-46 腐食性環境
比較パフォーマンスメトリック 財産 アルミニウム青銅 ステンレス鋼 銅ニッケル 熱伝導率 40-52 w/m・k 16-24 w/m・k 30-45 w/m・k 耐食性 素晴らしい 良い とても良い ファウリング抵抗 高い 適度 適度 コストファクター 1.5-2.0x 1.0x 1.3-1.8x
設計最適化戦略 1。チューブジオメトリの最適化 パラメータ 標準範囲 最適化された範囲 効率の影響 肉厚 0.9-1.2mm 0.7-1.0mm +5-8% 内面の仕上げ RA 1.6-3.2 RA 0.8-1.6 +3-5% Tube Pitch 1.25-1.5D 1.15-1.25D +4-7%
2. Flow Configuration Optimization Configuration 応用 Efficiency Gain Pressure Drop Counter-flow High ΔT Base reference 適度 Enhanced Counter-flow Critical service +10-15% 高い Multi-pass Limited space +5-8% 高い Cross-flow Gas cooling +3-5% 低い
Performance Enhancement Techniques 1. Surface Enhancement Methods 方法 説明 Efficiency Gain コストの影響 Internal Grooving Helical grooves +15-20% +30% External Fins Integral fins +25-30% +40% Knurling Surface texturing +10-15% +20% Micro-channels Internal channels +20-25% +45%
2. Flow Distribution Optimization 技術 Implementation 利点 考慮 Inlet Vanes Flow directors Even distribution Pressure drop Baffle Spacing Optimized gaps Better mixing メンテナンス Pass Arrangement Multiple passes Higher velocity 複雑 Header Design Flow equalizers Uniform flow 料金
運用パラメーター 1. Recommended Operating Conditions パラメータ 通常の範囲 Maximum Range 最適な範囲 流体速度 1.0-2.5 m/s 0.5-3.0 m/s 1.5-2.0 m/s 温度 20-150°C -10-200°C 40-120°C Pressure 最大20バーまで 最大40バー 10-15 bar pH範囲 6.5-8.5 5.0-9.0 7.0-8.0
2. Performance Monitoring Parameters パラメータ 測定方法 頻度 アクションのしきい値 熱伝達係数 温度センサー 毎日 <85%デザイン Pressure Drop 圧力計 時給 > 120%の設計 流量 フローメーター 連続 <90%デザイン ファウリングファクター 計算 毎週 > 120%の設計
メンテナンスと効率の保存 1。クリーニングスケジュール サービスタイプ クリーニング方法 頻度 効率の影響 軽い義務 化学洗浄 6ヶ月 +5-10% 中程度 機械的クリーニング 3ヶ月 +10-15% ヘビーデューティ 組み合わせた方法 毎月 +15-20%
2。予防保守 活動 頻度 目的 効率への影響 検査 毎月 早期検出 ベースラインを維持します テスト 四半期 パフォーマンス検証 +2-5% クリーニング 必要に応じて ファウリング除去 +5-15% 交換 5〜10年 信頼性 デザインに戻ります
効率最適化ケーススタディ ケーススタディ1:化学処理プラント アプリケーション:プロセスクーラー 最適化:強化されたチューブ表面 結果: 効率が25%増加します エネルギーコストの30%の削減 40%長いクリーニング間隔 ケーススタディ2:発電 アプリケーション:蒸気コンデンサー 最適化:フロー分布 結果: 15%の効率改善 ポンプ電力の20%の減少 メンテナンスの35%減少 費用便益分析 1。投資上の考慮事項 改善 コストプレミアム 回収期間 ROI 基本チューブ ベース ベース ベース 強化された表面 +30% 1。5年 180% 最適化されたデザイン +20% 1。2年 200% 結合されたソリューション +45% 2.0年 160%
2。運用貯蓄 カテゴリー 潜在的な節約 実装コスト 純利益 エネルギー 15-25% 中くらい 高い メンテナンス 20-30% 低い 非常に高い 交換 30-40% 高い 中くらい
ベストプラクティスの概要 設計フェーズ チューブジオメトリを最適化します 適切なグレードを選択します 強化機能を検討してください メンテナンスの計画 インストール 適切なチューブサポート 正しいフローアライメント 品質管理 パフォーマンステスト 手術 重要なパラメーターを監視します 最適な条件を維持します 定期的な検査 予防保守 メンテナンス 定期的なクリーニング パフォーマンス監視 条件評価 タイムリーな交換 将来の傾向 物質開発 高度な合金 表面処理 ナノコーティング スマートマテリアル デザインの革新 3D印刷アプリケーション 計算最適化 ハイブリッドシステム モジュラーデザイン 結論 熱交換器でアルミニウムブロンズチューブを最適化するには、次のことが必要です。
慎重な材料選択 適切な設計上の考慮事項 定期的なメンテナンス パフォーマンス監視 継続的な改善 適切に実装された場合、これらの戦略は以下につながる可能性があります。
15-30%の効率改善 20-40%のメンテナンスコスト削減 25-35%のエネルギー節約 拡張サービス寿命 通常、最適化への投資は、長期的な運用上の利益と信頼性の向上を提供しながら、1〜2年以内にそれ自体に支払われます。

